|
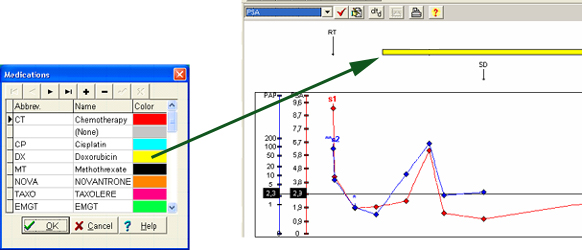
Long-term medications
appear as a colored bar in the graphic, whereas single events, like
radiotherapy appear as an abbreviation (two characters) within your
graphic
The cut-off will be
displayed as a one black horizontal line in the graphic
The Y-scales are
adjusted in such a way that different cut-off values for different
markers appear at the same vertical position
|