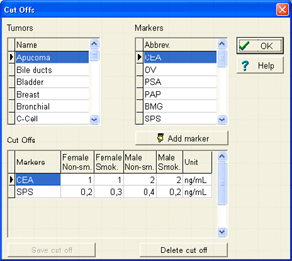
- Select a combination of
tumor and marker and define a cut-off, which will be displayed as
a horizontal line in the graphic
-
For
each tumor you can investigate as many markers as necessary and you
can define your own cut-off for each tumor/marker combination
- In the graphic the
y-scales will be adjusted in such a way that the y-coordinate for
each cut-off will be the same
|